開啟輔助訪問
 找回密碼
 立即加入

15L.Maria 加速朝東北前進

查看數: 42463 評論數: 44 收藏 0切换到帖子模式
    組圖打開中,請稍候......
發佈時間: 2017-9-14 20:32

正文摘要:

  五級颶風   編號:15 L 名稱:Maria   基本資料   擾動編號日期:2017 年 09 月 14 日 20 時 命名日期  :2017 年 09 月 17 日 05 時 撤編日期  :2017 年 00 月 00 ...

蜜露 發表於 2018-5-30 22:02
本帖最後由 蜜露 於 2018-5-30 23:13 編輯


颶風瑪麗亞 , 死亡人數在哈佛大學真實估計公佈是4645人死亡 . 遠高於官方的數字 .


這是2013年颱風海燕吹襲菲律賓以來 , 最嚴重的一次風災 .

波多黎各 13米風暴潮+4645人死亡

https://read01.com/3GDP0xQ.html#.Ww6tyX34mUk
581978f0f736afc3e57bfd70b819ebc4b7451202.jpg

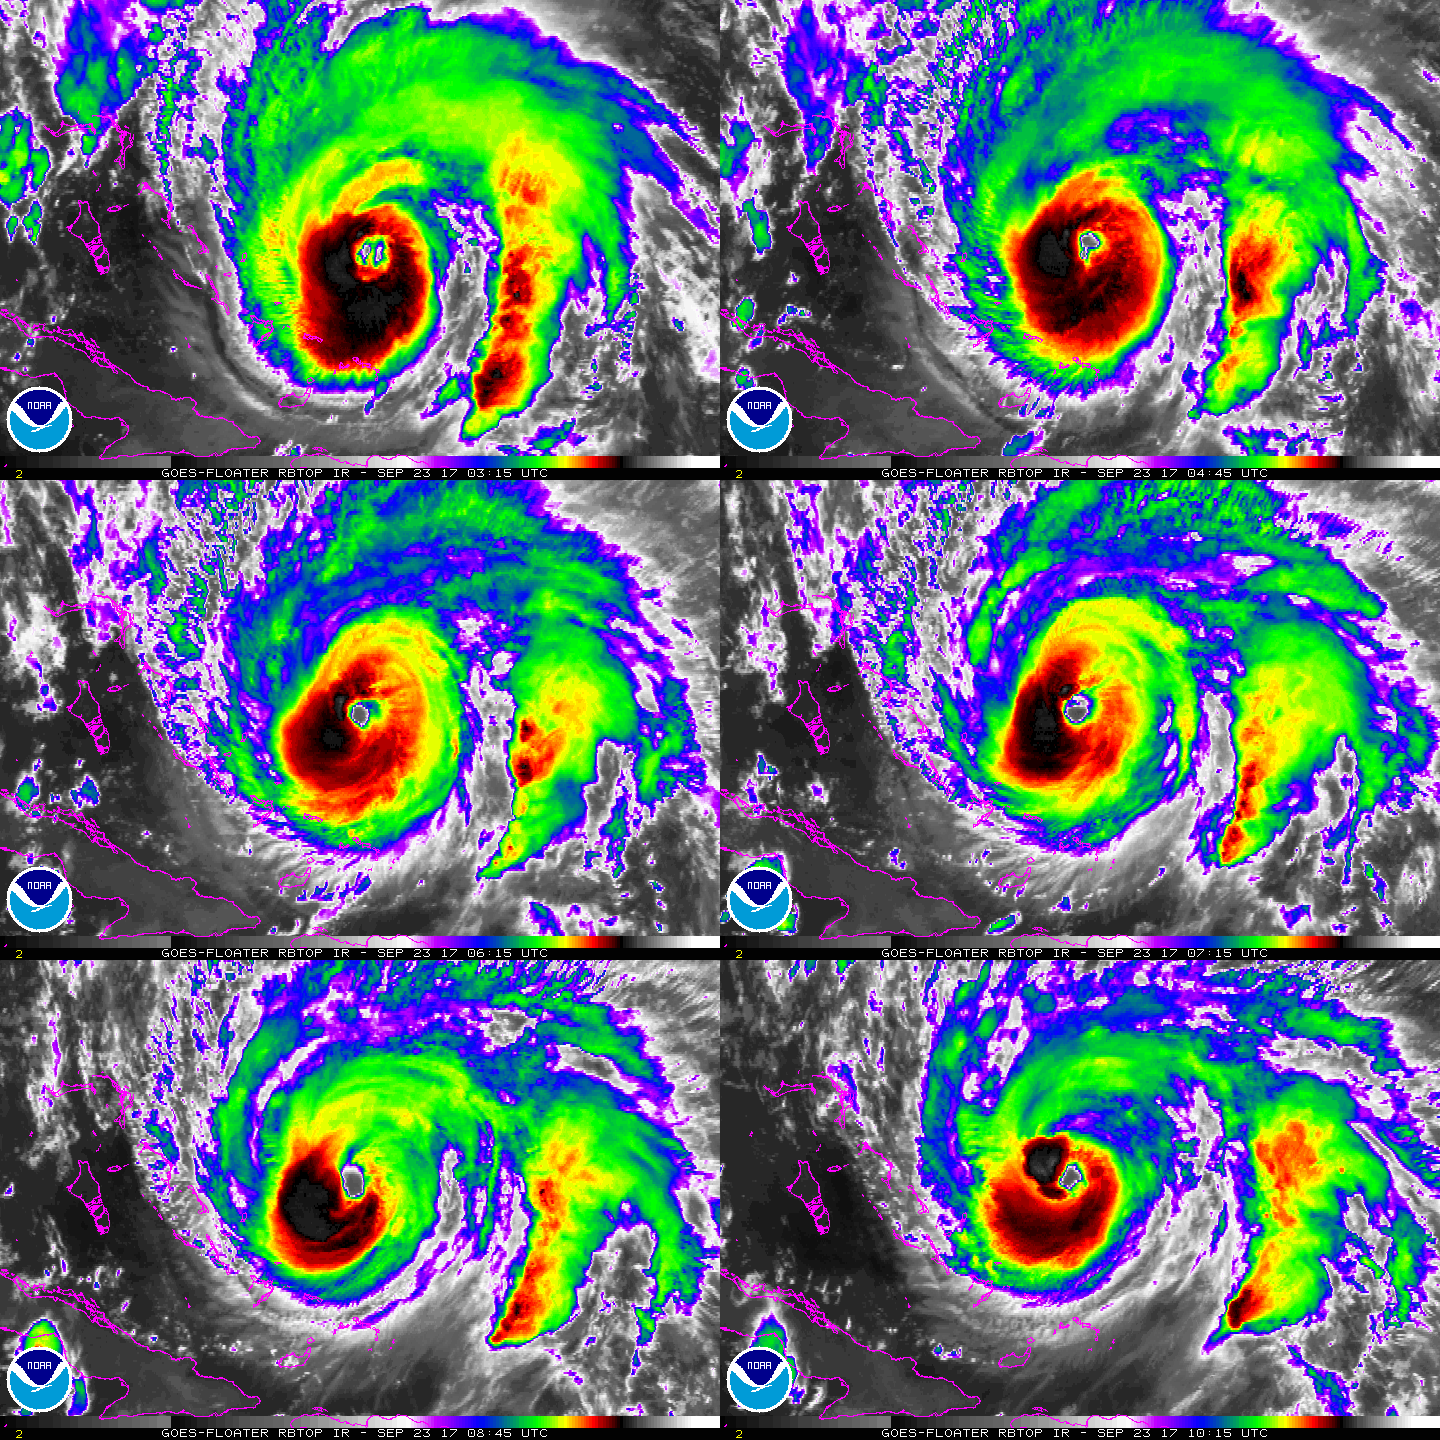
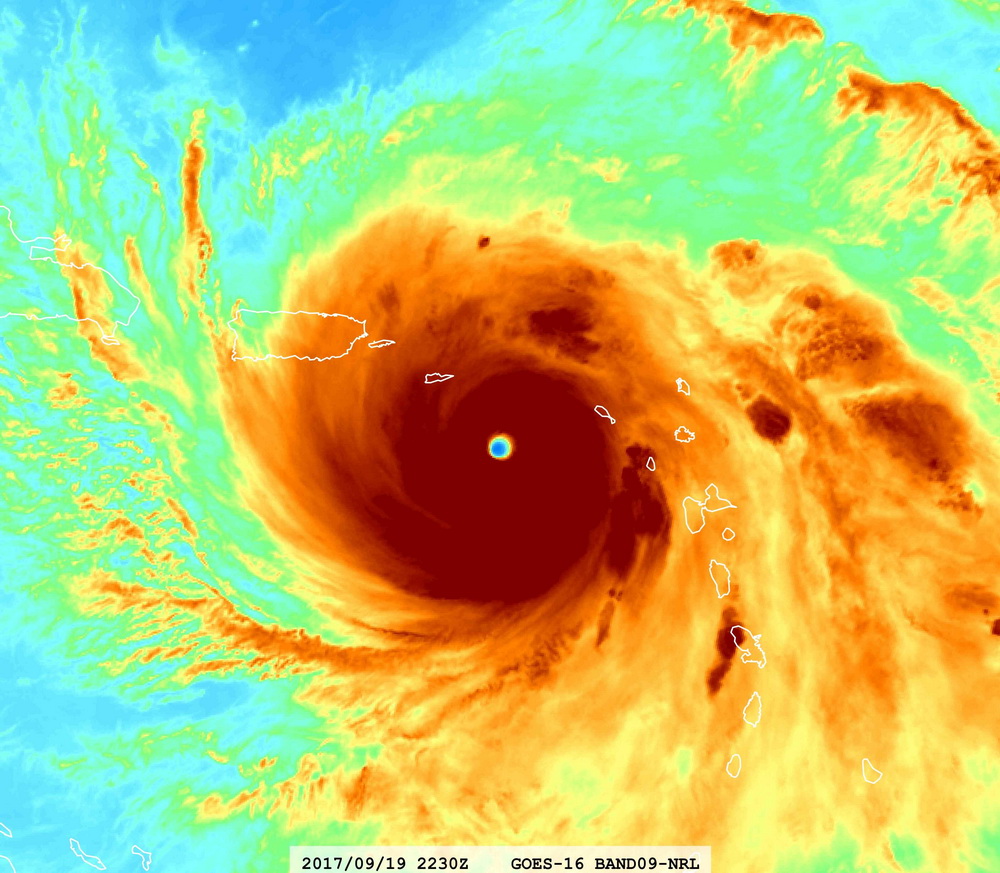
瑪麗亞傭有2017年最頂級的風眼 .
蜜露 發表於 2017-12-16 22:24


瑪莉亞颶風登陸波多黎各


洪水的其中地方之一 , Ciales的影像釋出 .  約6米
蜜露 發表於 2017-10-1 01:16
本帖最後由 蜜露 於 2017-10-1 01:40 編輯

今年的熱帶氣旋壽命很長。

諾盧 、艾瑪、荷西、瑪麗亞。

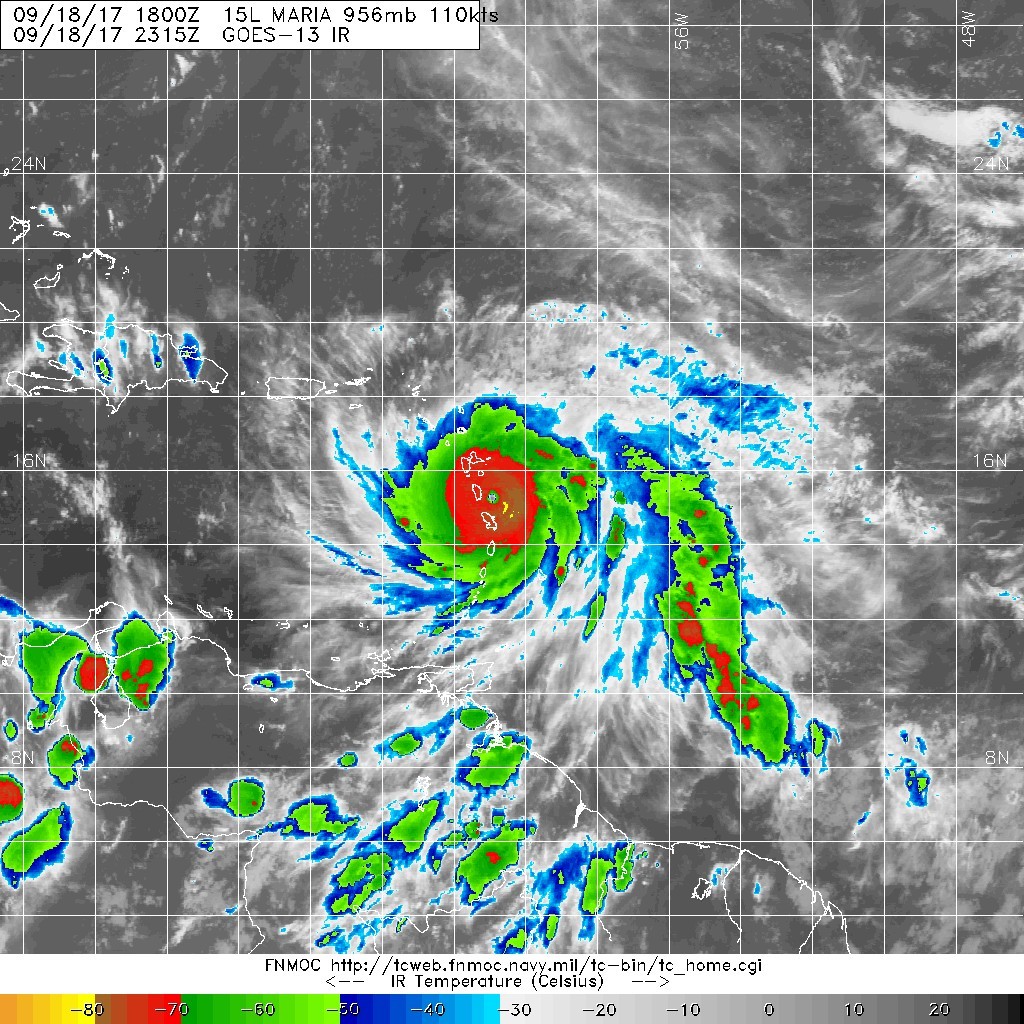
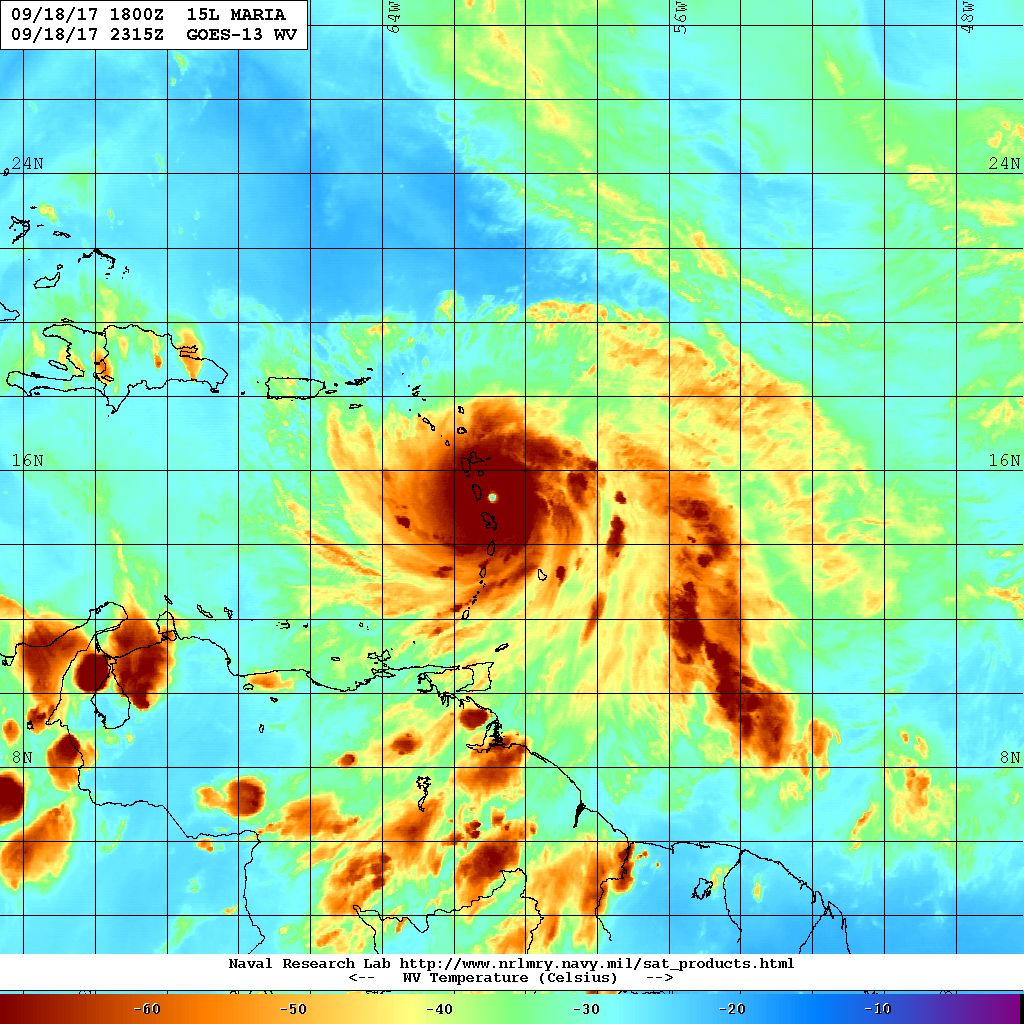
瑪麗亞颶風一次顛峰
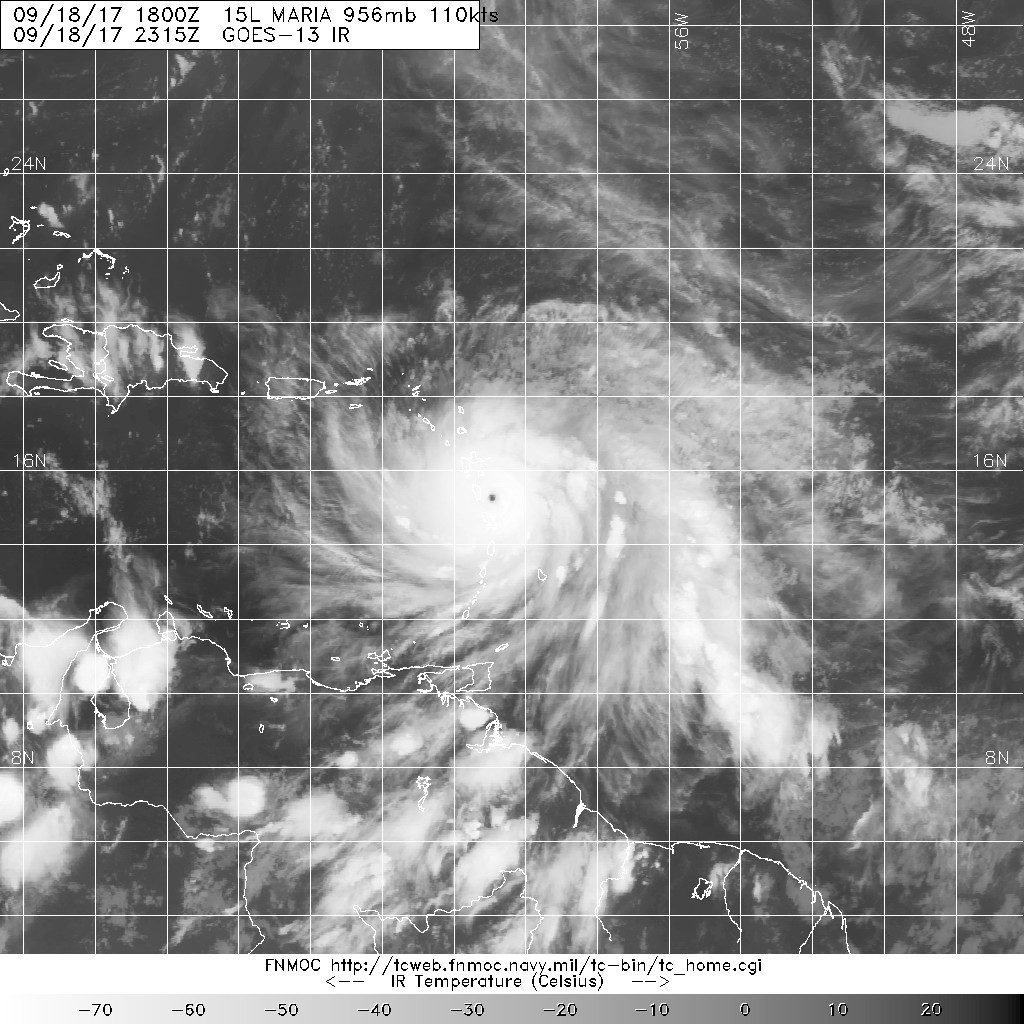
20170918.2315.goes-13.ir.15L.MARIA.110kts.956mb.14.9N.60.4W.100pc.jpg


20170918.2315.goes-13.ircolor.15L.MARIA.110kts.956mb.14.9N.60.4W.100pc.jpg


20170918.2315.goes13.x.wv1km.15LMARIA.110kts-956mb-149N-604W.100pc (1).jpg


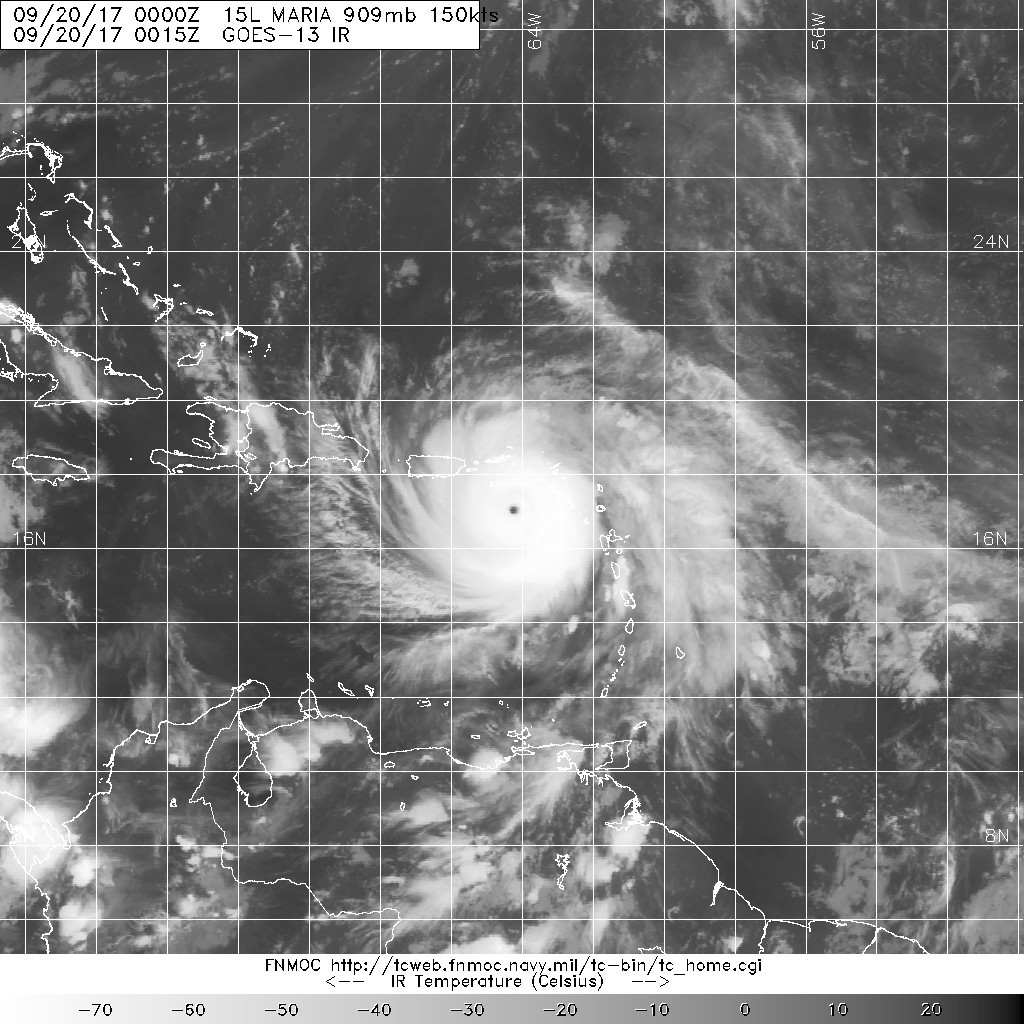
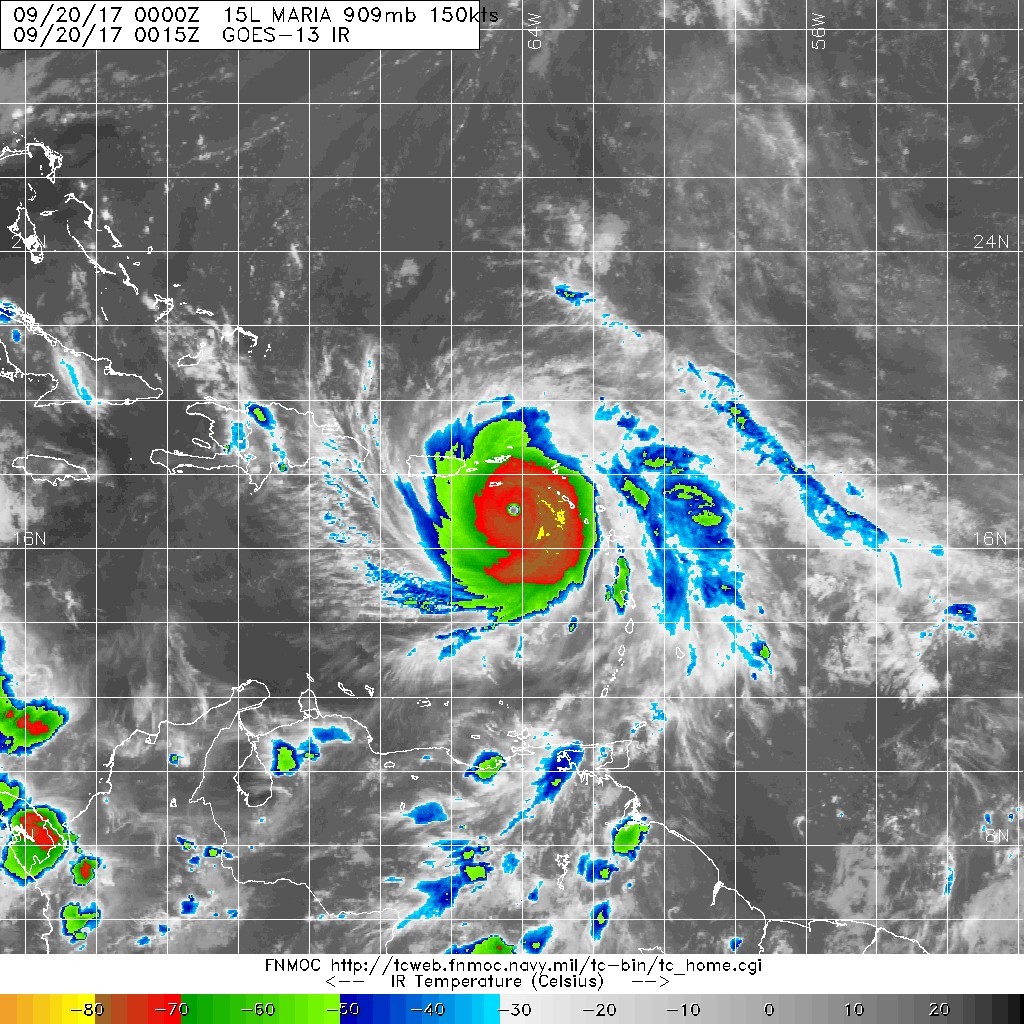
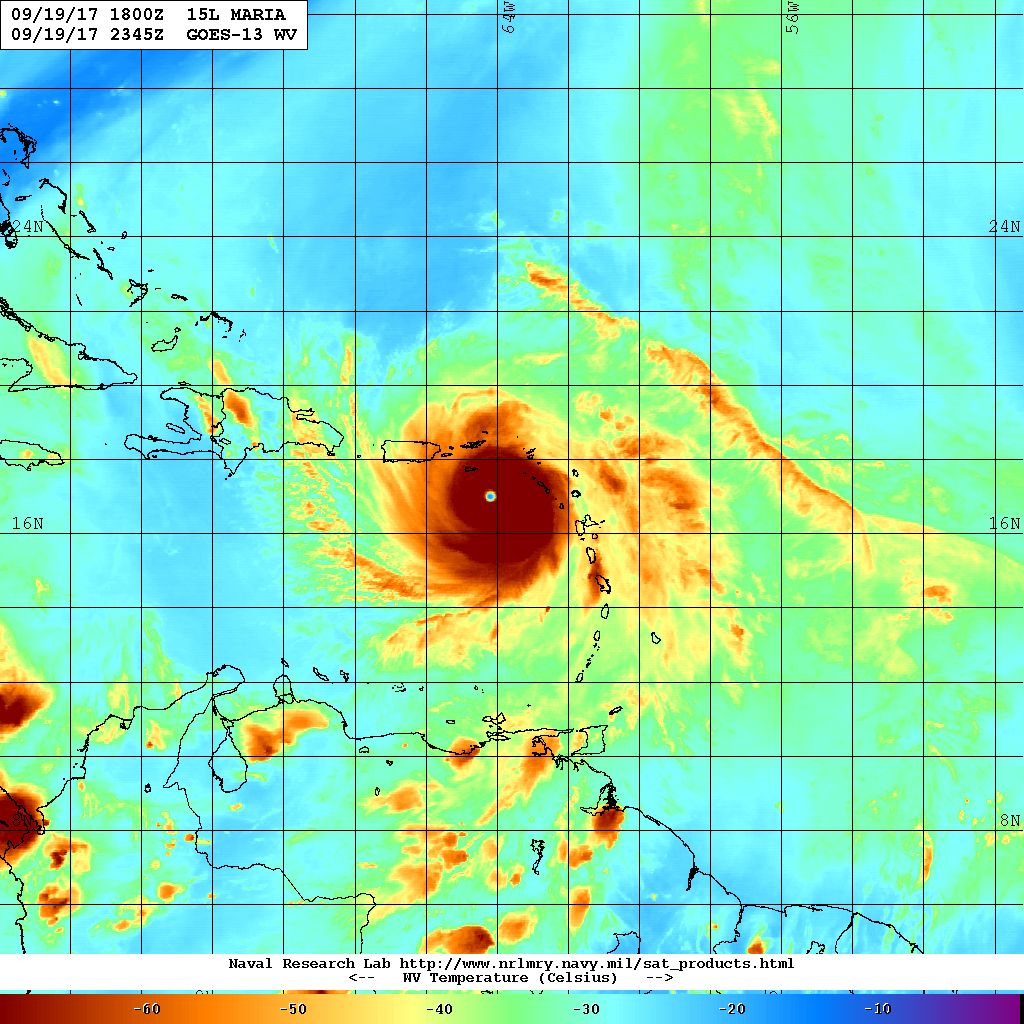
瑪麗亞颶風二次巔峰

20170920.0015.goes-13.ir.15L.MARIA.150kts.909mb.17N.64.3W.100pc.jpg


20170920.0015.goes-13.ircolor.15L.MARIA.150kts.909mb.17N.64.3W.100pc.jpg


20170919.2345.goes13.x.wv1km.15LMARIA.145kts-920mb-166N-636W.100pc.jpg


瑪麗亞拿兩張的巔峰主要是因為,一顛峰像1992蓋伊。
瑪麗亞的一顛峰其實潛力更好,是針眼實測140Kts的,但正好登陸了多米尼克。

雖然後來整體強度都不如二顛的小眼,但是一顛很有氣勢。如果不是因為風眼登陸了多米尼克島。
或許瑪麗亞的真實強度更強,可不輸給艾瑪。
瑪麗亞的modis是深藍眼(莫蘭蒂風眼的等級).
從針眼至小眼.
另外我發現瑪麗亞很像2013利奇馬 針眼至小眼 (同樣modis也是深藍眼與瑪麗亞同個等級)
或許利奇馬也是個150Kts+
波多黎各的風暴潮錯誤已確定. 但也很驚人 (13米!!!)


波多黎各在Palomas的79呎已經證實是錯誤的,  79呎=24米 (這是311地震大海嘯的等級....)
證實是虛驚一場。

最高的紀錄是Cidia的42呎. 約13米~而首都聖胡安是12呎(3米). 而其中一個影片Toa Baja地方也有達到8米.


近年的風暴潮紀錄

2017 颶風-瑪麗亞   13米
2005 颶風-卡翠娜     8米
2013 颱風-海燕         7米

總之無論如何,波多黎各經濟困難。災後重建恐怕不是很容易。

評分

參與人數 1水氣能量 +20 收起 理由
jwpk9899 + 20 好特別!

查看全部評分

s6815711 發表於 2017-9-30 09:22
本帖最後由 s6815711 於 2017-9-30 09:33 編輯

從命名到現在已經達13天
將持續朝東北前進
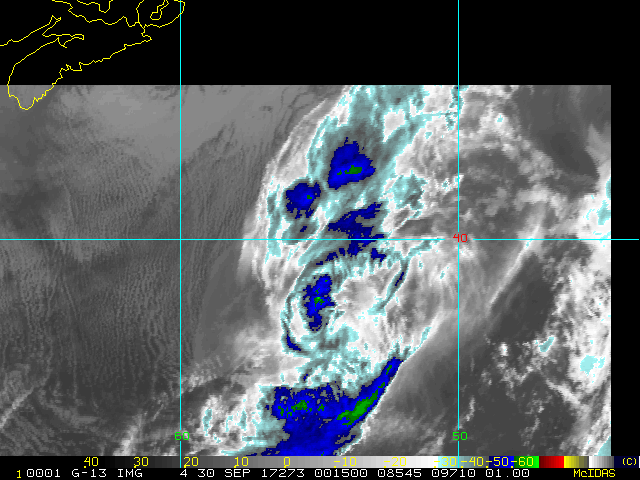
2017AL15_4KMIRIMG_201709300015.GIF


t02436 發表於 2017-9-27 12:01
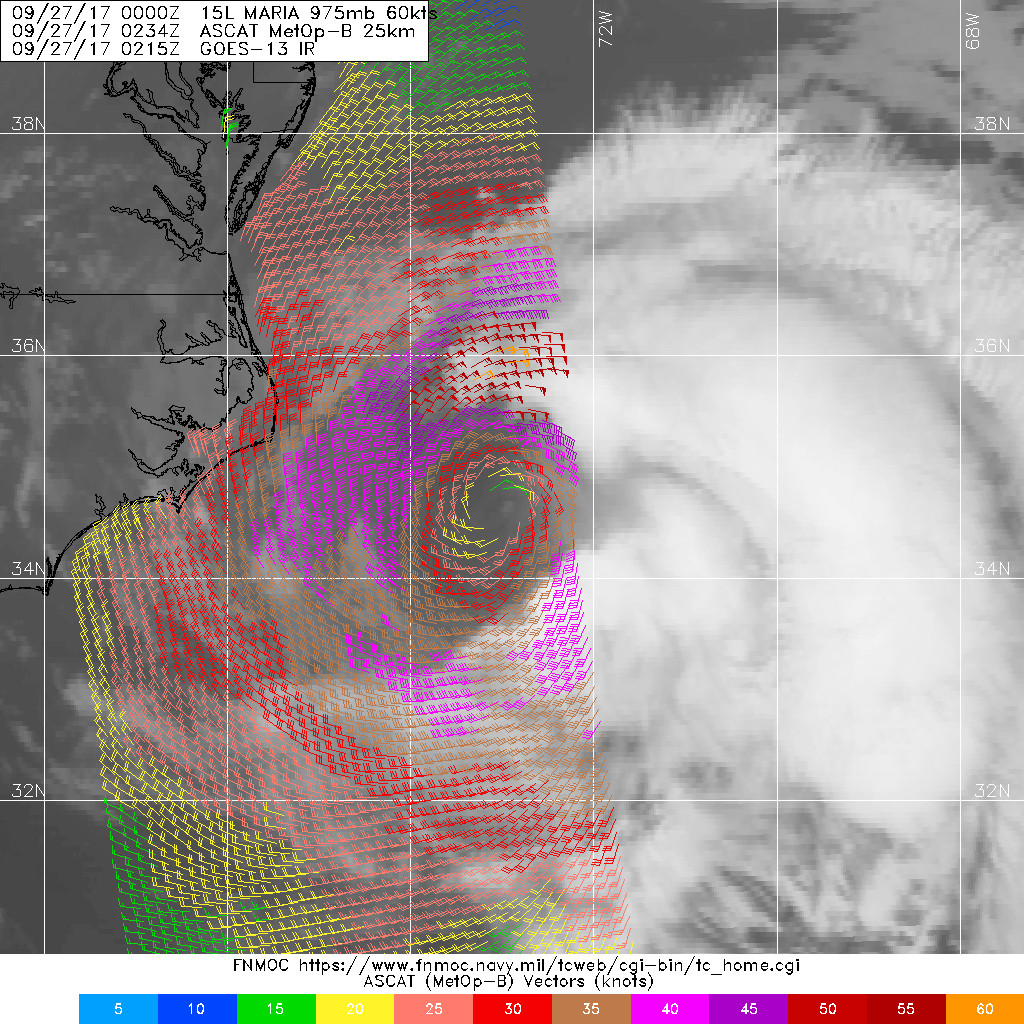
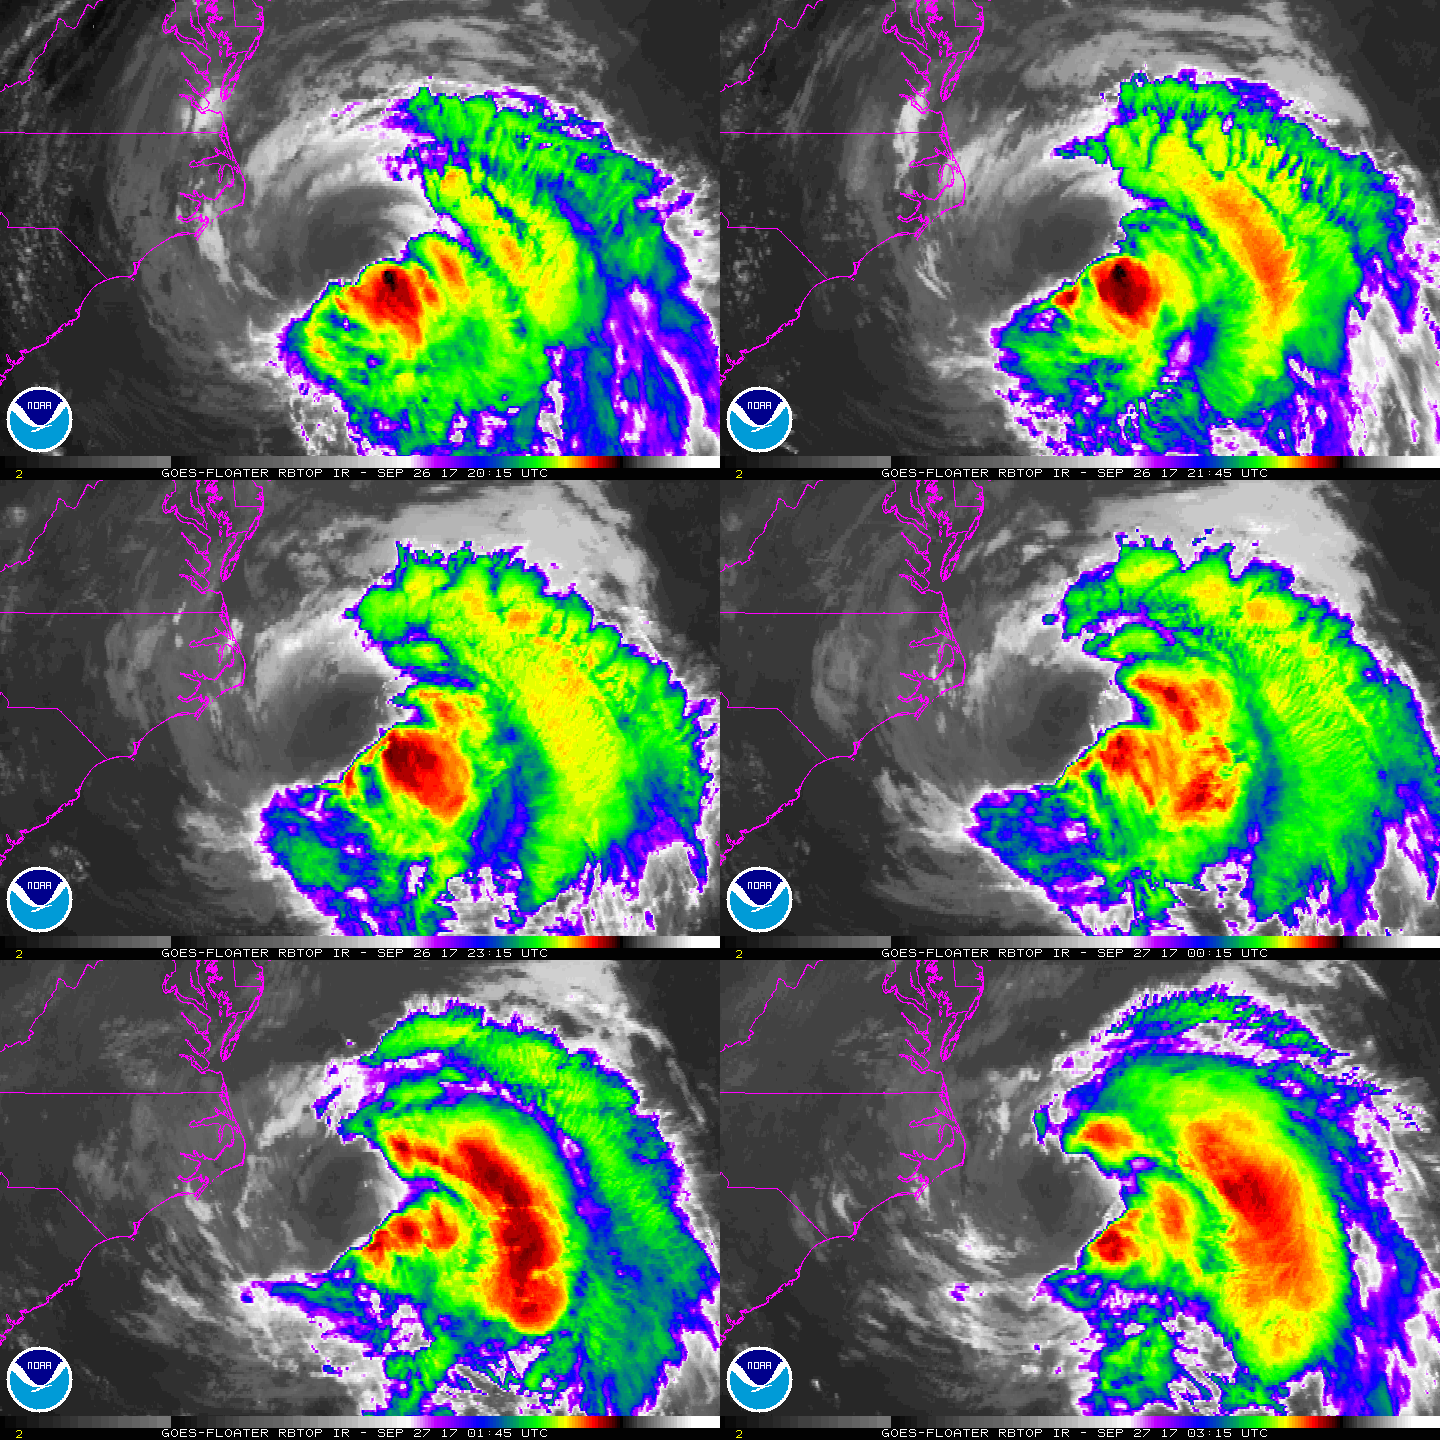
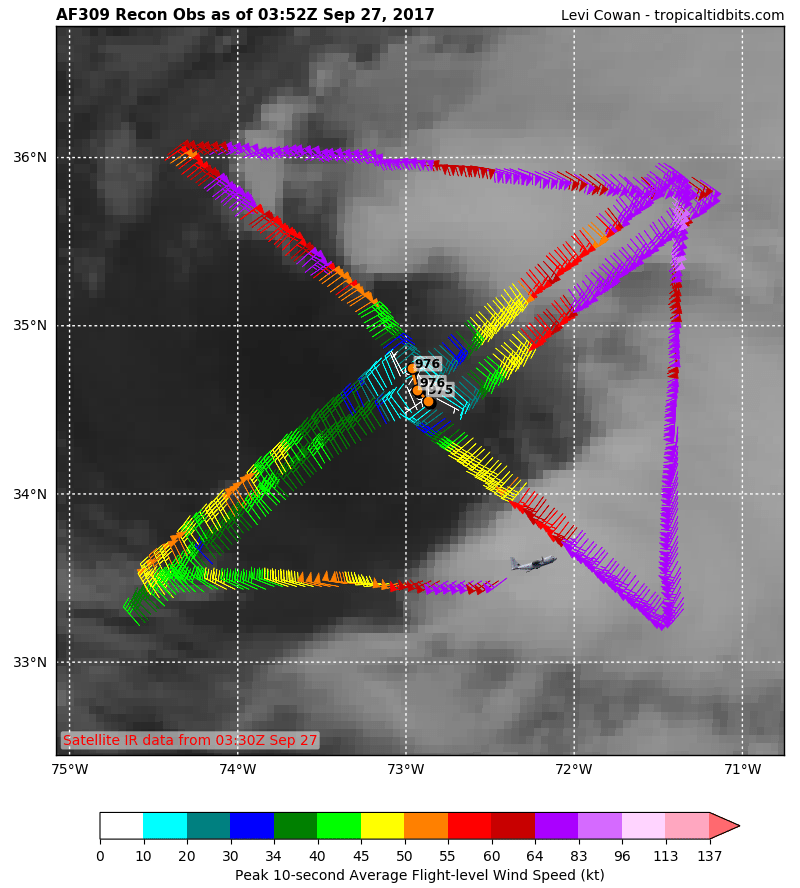
中心在北卡東方外海,準備再轉向衝向愛爾蘭。
ZCZC MIATCDAT5 ALL
TTAA00 KNHC DDHHMM

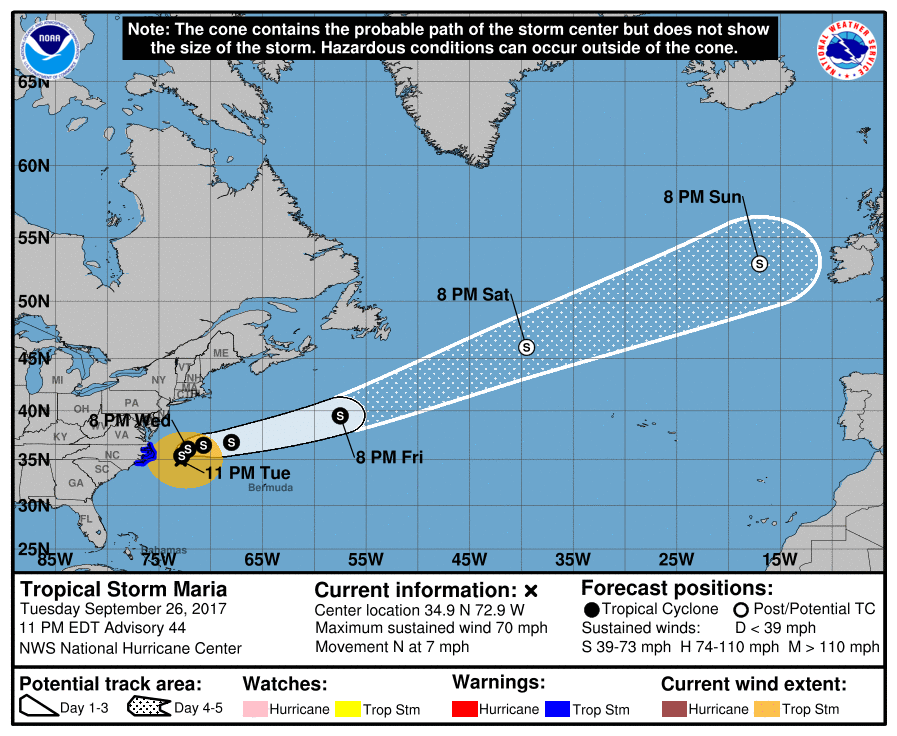
Tropical Storm Maria Discussion Number  44
NWS National Hurricane Center Miami FL       AL152017
1100 PM EDT Tue Sep 26 2017

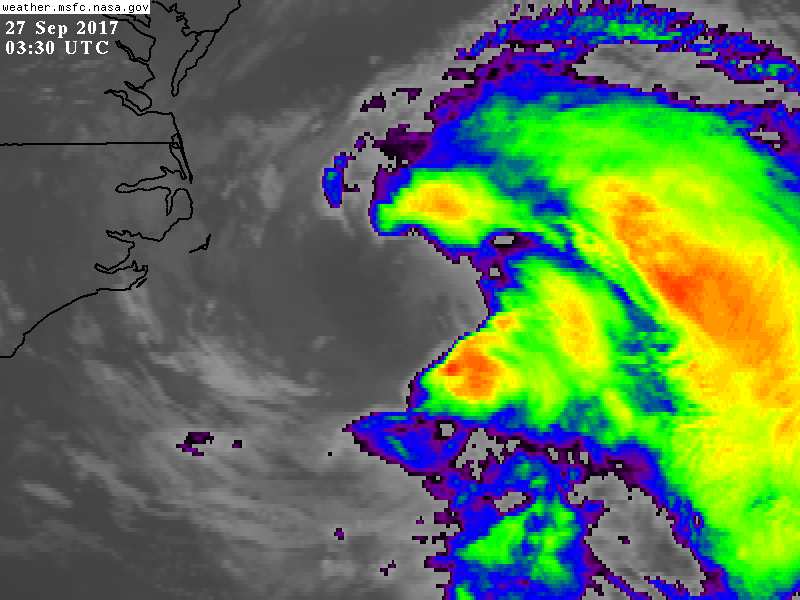
Practically all of the deep convection associated with Maria is
over the eastern semicircle of the circulation, and the center is
exposed near the edge of the dense overcast due to moderate
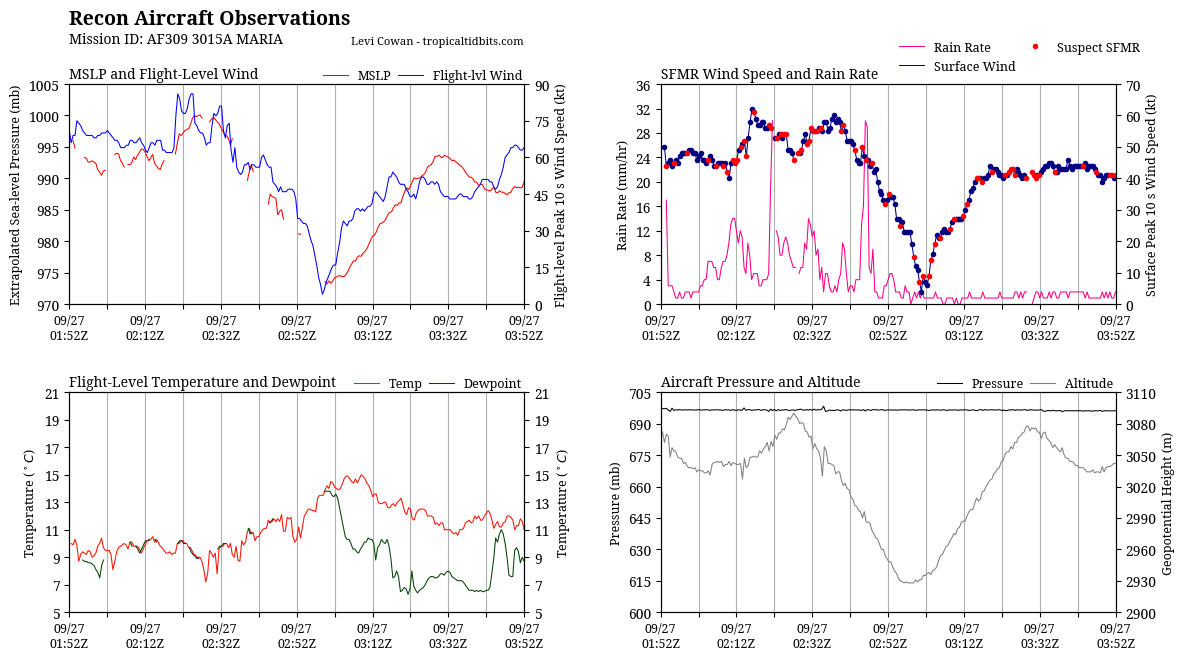
west-northwesterly shear.  SFMR-observed surface winds from an Air
Force Hurricane Hunter aircraft support a current intensity of 60
kt, although satellite classifications indicate a much weaker
cyclone.  Since SSTs are not expected to cool significantly along
the projected path of Maria over the next couple of days, only
slight weakening is forecast up to 72 hours.  Later in the forecast
period, the global models depict the cyclone as embedded in a
frontal zone, so the system is forecast to become extratropical by
day 4.

Maria continues to move slowly northward along the western periphery
of a subtropical ridge.  In 24-48 hours, the mid-latitude
westerlies should shift southward in association with a broad
mid-tropospheric trough moving across eastern North America.  This
should cause Maria to turn east-northeastward and then accelerate
ahead of the trough by late in the week.  The track models are in
general agreement on this scenario, however, the guidance has
become less tightly clustered.  This is especially true later
in the forecast period, where the ECMWF is much slower than the GFS
and HWRF models.  The official track forecast lies between these
options and is a little to the left of the previous one in the
early part of the period, in deference to the ECMWF solution.


KEY MESSAGES:

1. Maria is forecast to move roughly parallel to the U.S. east coast
for the next day or so, bringing some direct impacts to portions of
the North Carolina coast through Wednesday where a tropical storm
warning is in effect.

2. Storm surge flooding, especially along the sound side of the
North Carolina Outer Banks, is expected, and a storm surge warning
and watch are in effect for portions of eastern North Carolina.

3. Swells generated by Maria are affecting much of the east coast of
the United States.  These swells are also affecting Bermuda, the
Turks and Caicos Islands, and the Bahamas.  These swells are likely
to cause life-threatening surf and rip current conditions.  Please
consult products from your local weather office for more
information.

FORECAST POSITIONS AND MAX WINDS

INIT  27/0300Z 34.9N  72.9W   60 KT  70 MPH
12H  27/1200Z 35.4N  72.8W   60 KT  70 MPH
24H  28/0000Z 36.1N  72.2W   55 KT  65 MPH
36H  28/1200Z 36.5N  70.7W   55 KT  65 MPH
48H  29/0000Z 36.8N  68.0W   55 KT  65 MPH
72H  30/0000Z 39.5N  57.5W   55 KT  65 MPH
96H  01/0000Z 46.0N  39.5W   50 KT  60 MPH...POST-TROP/EXTRATROP
120H  02/0000Z 53.0N  17.0W   45 KT  50 MPH...POST-TROP/EXTRATROP

$$
Forecaster Pasch

NNNN

031543_5day_cone_no_line_and_wind.png

GOES03302017270GhCsIX.jpg

LATEST.jpg

rbtop-animated.gif

recon_AF309-3015A-MARIA.png

recon_AF309-3015A-MARIA_timeseries.png

點評

一副快變溫氣樣呀  發表於 2017-9-27 13:29
蜜露 發表於 2017-9-25 00:56


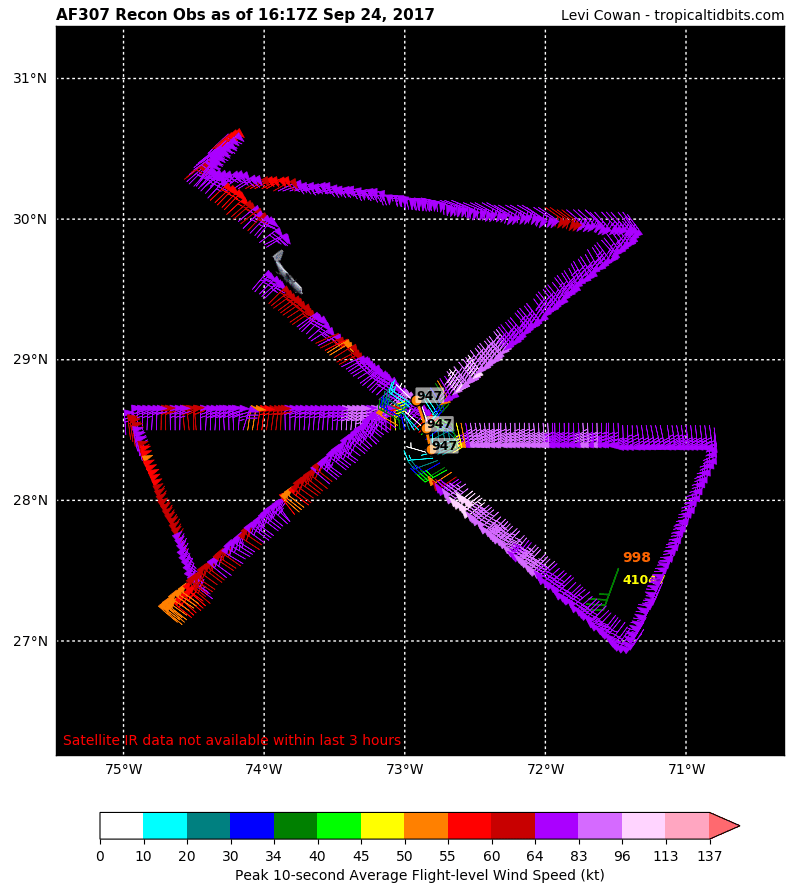
登陸波多黎各後,風切已經增強,加上艾瑪經過因素。環境不如以往,現在只剩Cat.2
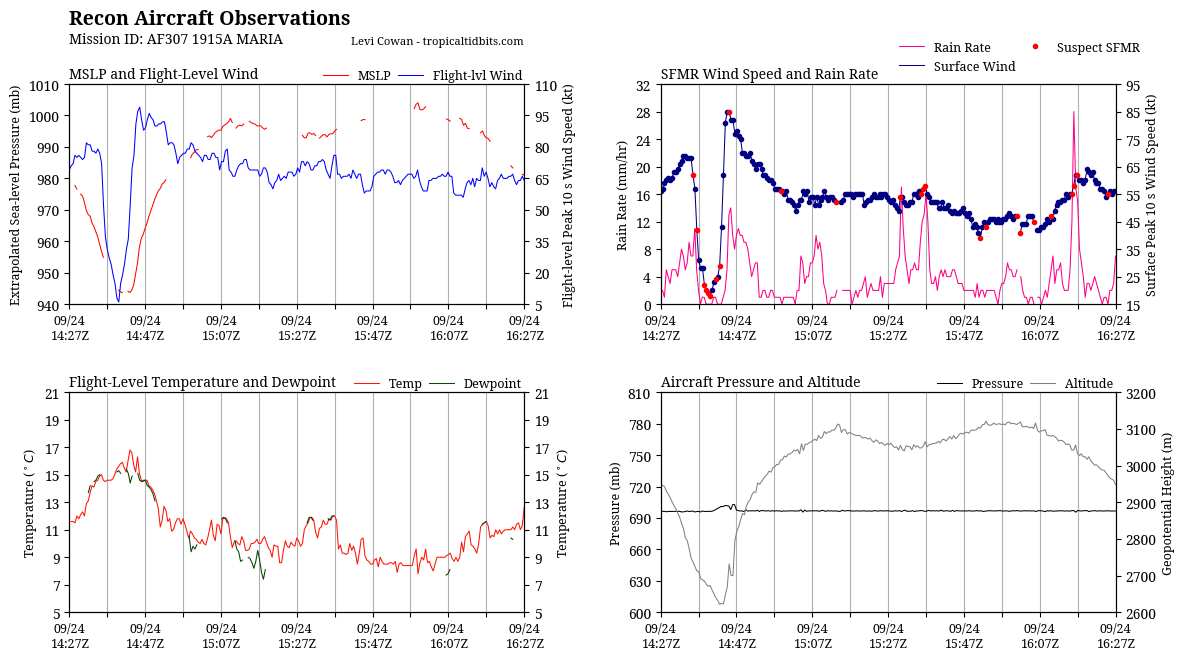
recon_AF307-1915A-MARIA_timeseries.png


recon_AF307-1915A-MARIA.png


另外李也Cat.1了,今年大西洋颶風很強。

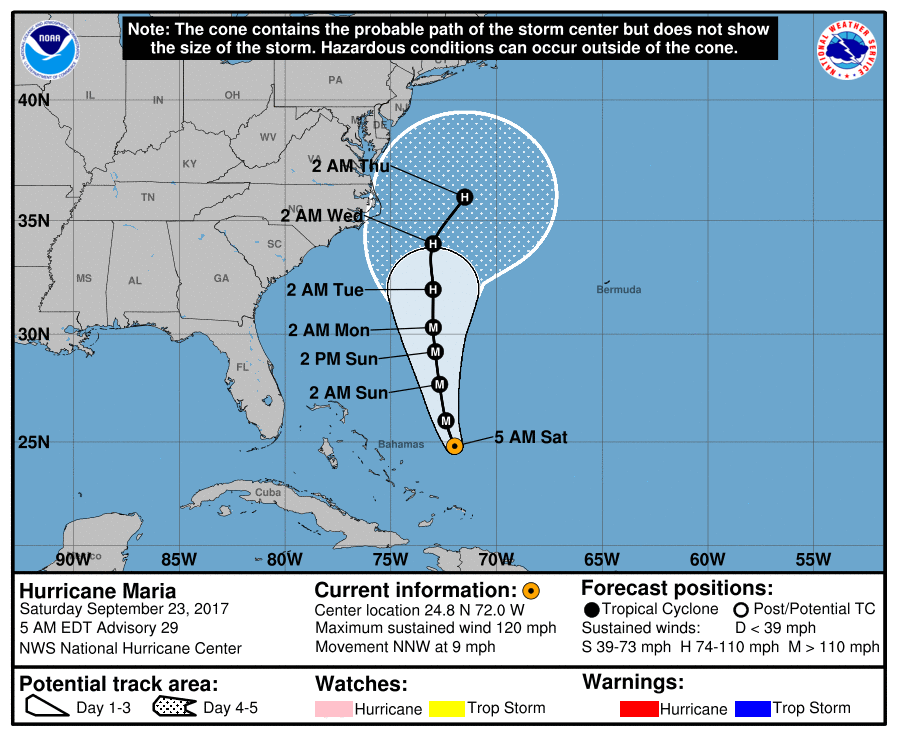
t02436 發表於 2017-9-23 18:39
仍是個C3,開始轉北進行,大概就複製Jose的路徑沿著西經72度附近北上。
000
WTNT45 KNHC 230853
TCDAT5

Hurricane Maria Discussion Number  29
NWS National Hurricane Center Miami FL       AL152017
500 AM EDT Sat Sep 23 2017

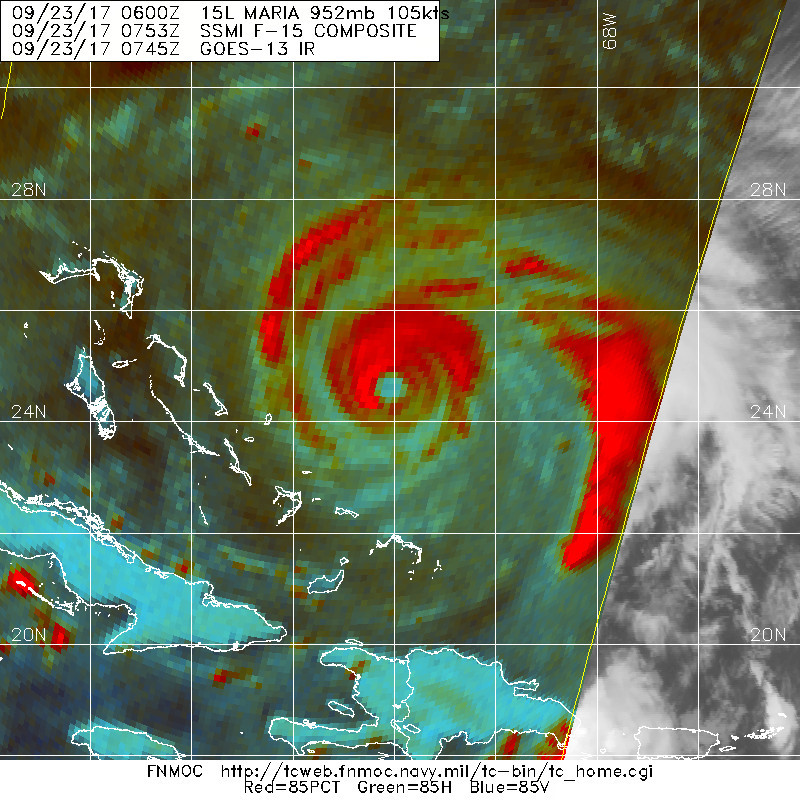
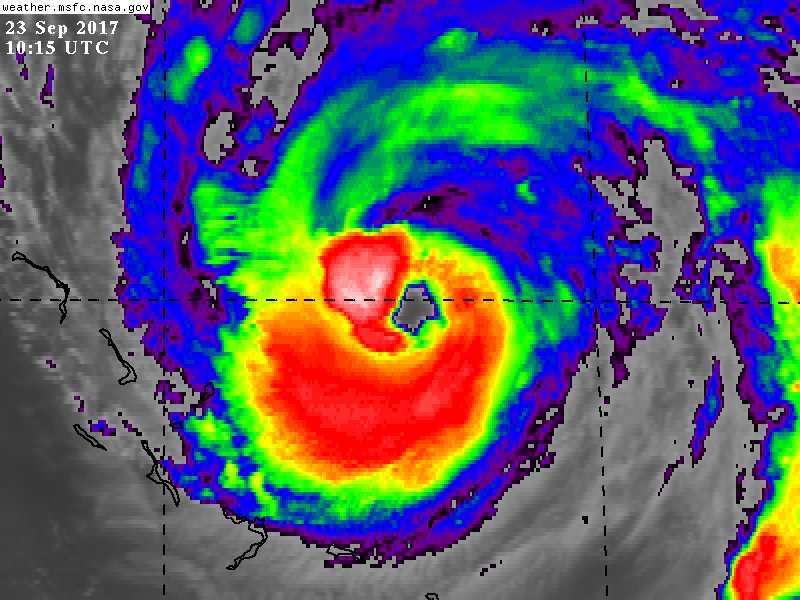
Maria is sending mixed signals regarding its intensity this
morning.  One one side, the 35 n mi wide eye has become better
defined in satellite imagery, and the last report from an Air Force
Reserve Hurricane Hunter aircraft indicated that the central
pressure had fallen to 952 mb.  On the other side, the
aircraft-reported winds decreased a little since the previous
advisory, with maximum 700-mb flight-level winds of 110 kt and
maximum surface wind estimates from the Stepped Frequency Microwave
Radiometer near 100 kt.  Based on the aircraft winds, the initial
intensity is lowered to 105 kt.  Various analyses show that Maria is
experiencing about 15 kt of southwesterly shear, which is likely the
reason for an asymmetric distribution of convection in the eyewall
at this time.

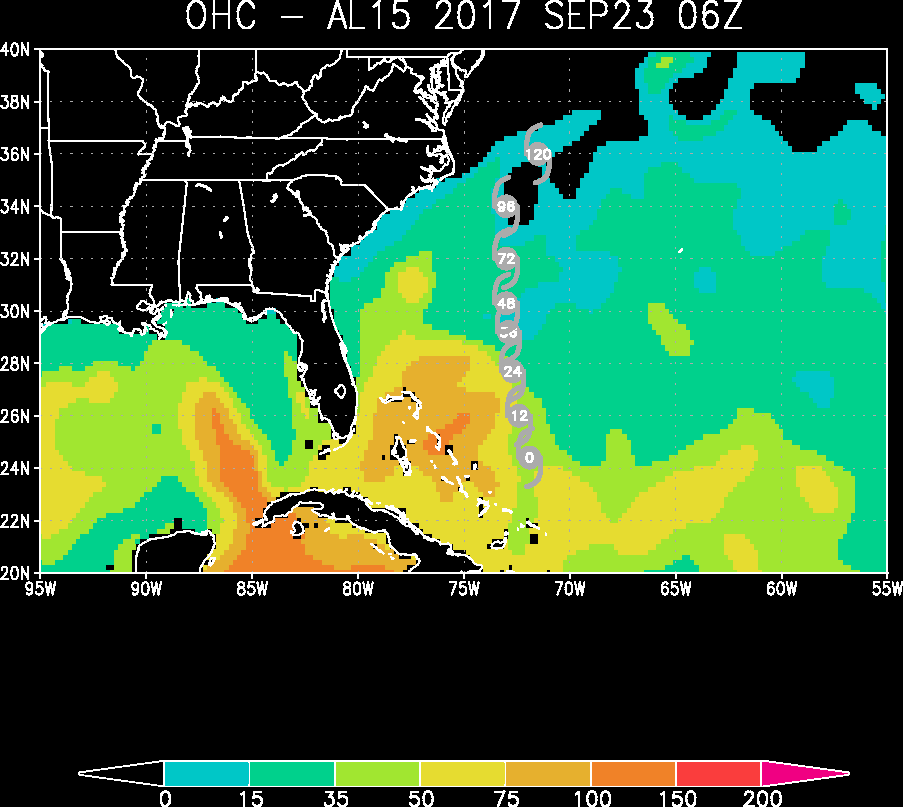
The hurricane is likely to stay over warm water in an environment
of light to moderate shear for the next 36-48 h.  The intensity
forecast during this time will show some fluctuations in strength,
with the forecast lying near the upper edge of the intensity
guidance.  After 48 h, the forecast track takes Maria over the cold
sea surface temperatures left behind by former hurricane Jose,
which are below 26C in some areas.  This should cause a pronounced
weakening, and the new forecast is similar to the old forecast
in showing such a trend during this time.

The initial motion remains 345/8.  Maria is currently being steered
by a subtropical ridge to the east of the hurricane and a mid- to
upper-level trough over the southeastern United States.  This
combination should cause a north-northwestward to northward motion
for the next couple of days. After that, the ridge is forecast to
amplify toward the northwest due to the influence of a mid- to
upper-level ridge in the westerlies moving through the northeastern
United States.  The track guidance has responded to this evolution
by shifting westward since the last advisory, with several of the
global models now calling for Maria to come close enough to the
U. S. east coast to cause direct impacts before the system recurves
into the westerlies around 120 h. The latter part of the forecast
track is also shifted to the west, but it lies to the east of the
consensus models and the center of the guidance envelope.  If the
current model trends continue, additional westward adjustments to
the track forecast will be necessary later today.


KEY MESSAGES:

1. Swells from Maria are expected to increase along the coast of
the southeastern United States and will likely cause dangerous surf
and life-threatening rip currents for the next several days.

3. Maria will likely move between the east coast of the United
States and Bermuda by the middle of next week.  While the forecast
track has moved closer to the U. S. east coast, it is still too soon
to determine what, if any, direct impacts there might be in these
areas.

4. For more information on the flooding and rip current hazards in
the United States, please monitor information from your local
National Weather Service forecast office at www.weather.gov.


FORECAST POSITIONS AND MAX WINDS

INIT  23/0900Z 24.8N  72.0W  105 KT 120 MPH
12H  23/1800Z 26.0N  72.4W  110 KT 125 MPH
24H  24/0600Z 27.7N  72.7W  110 KT 125 MPH
36H  24/1800Z 29.2N  72.9W  105 KT 120 MPH
48H  25/0600Z 30.3N  73.0W  100 KT 115 MPH
72H  26/0600Z 32.0N  73.0W   85 KT 100 MPH
96H  27/0600Z 34.0N  73.0W   70 KT  80 MPH
120H  28/0600Z 36.0N  71.5W   65 KT  75 MPH

$$
Forecaster Beven

085915_5day_cone_with_line.png

20170923.0753.f15.85rgb.15L.MARIA.105kts.952mb.24.4N.71.9W.085pc.jpg

2017AL15_OHCNFCST_201709230600.GIF

GOES10152017266tMKMzS.jpg

rbtop-animated.gif

本平台僅供學術討論之用,預報應以氣象局為準

威普網站虛擬主機贊助公司

臺灣第一個天氣類型社群平台 即時天氣資訊、精準颱風動態

線上客服
FB傳送訊息
廣告行銷
精準行銷 物超所值
官方粉專
發佈 快速回復 返回頂部 返回列表